
Why your Search Console data is lying to you
Here is the core issue. When Google shows an AI Overview for a query, and your page is either cited inside it or ranks below it, an impression is still counted. That impression looks identical in your reports to the kind that used to convert at 3 to 5 percent. It no longer does.
Seer Interactive's analysis of 25.1 million impressions across 42 organisations found that when an AI Overview appears, organic click-through drops from 1.76 percent to 0.61 percent, a 61 percent decline. Ahrefs' December 2025 study reached a similar conclusion: a 58 percent CTR drop on position-one content when an AI Overview is present. Depending on query type, other analyses put the impact anywhere between 15 and 89 percent. The range is wide. The direction is not in doubt.
One countervailing signal is worth holding onto: brands cited inside those AI Overviews earn roughly 35 percent more organic clicks than those that are not. Citation is not a vanity metric. It is a traffic metric.
The diagnostic trap
Aggregate web search data has misled a lot of teams into believing performance was stable, when in fact rising AI Overview impressions were masking real click declines on traditional listings. If you only look at totals, you will miss it.
AI Overviews vs AI Mode: two different tracking problems
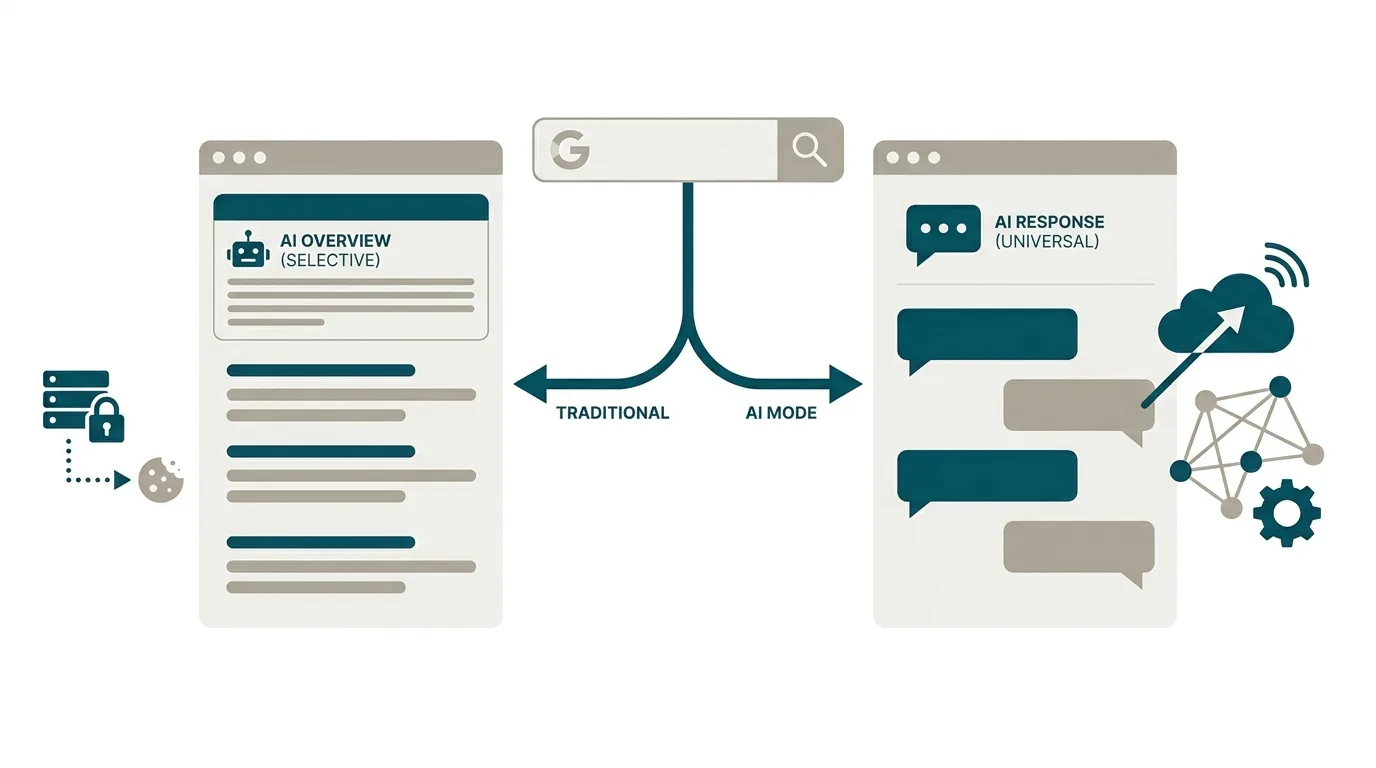
Before you build any tracking, separate the two things Google is doing. AI Overviews are generated summaries that appear at the top of a normal results page, and they only trigger for a subset of queries. AI Mode, which rolled out to all US users on 20 May 2025, is a distinct search experience that generates a response for every query.
Prevalence figures for AI Overviews vary by source and methodology. seoClarity puts them on 30 percent of US desktop keywords as of September 2025, up from 10 percent in March 2025. Otterly.ai reports nearly half of all queries by February 2026. Semrush's sensor has landed lower. Do not pick a single number and treat it as gospel. The honest answer is that AI Overviews now appear on a large and growing share of commercial queries, and mobile frequency has risen sharply year on year.
Because AI Mode is universal and AI Overviews are selective, they need different tracking. For AI Overviews, you care about trigger rate per keyword, then citation. For AI Mode, everything triggers, so the only question is whether you are cited and where.
What GSC now shows (and what it still hides)
Since June 2025, Google has surfaced AI Mode data inside Search Console, and the Search Type filter now separates AI Overviews and AI Mode from ordinary web search. Google's documentation clarifies the counting rules: an AI Overview occupies a single position, all links inside it share that position, a click on an outbound link counts as a click, and standard impression rules apply (the link must be scrolled or expanded into view).
That is genuine progress. What GSC still does not tell you:
- Which specific URLs of yours were pulled into which AI Overview
- When your brand was mentioned without a clickable citation
- How often competitors are cited on the same queries
- Your position inside an AI Overview (Google's summaries typically cite 3 to 8 sources)
Useful, but partial.
The CTR divergence diagnostic
The fastest way to spot AI Overview pressure using only GSC is the divergence diagnostic. Go to Performance, Search Results, and toggle on both Total Impressions and Total Clicks. Look for queries or pages where impressions trend flat or up while clicks trend down over the same window. Filter by country and device if the pattern is muddled at aggregate level.
Once you see the pattern, sample five or ten of the affected queries in an incognito window. If AI Overviews are triggering on most of them, you have your answer. That is when you escalate from GSC to a tool that can actually see inside the overview.
The metric set that actually matters now
The old scorecard was position, impressions, clicks and CTR by query. It still has a role, but it is no longer sufficient. Here is the metric set we now use with clients when reporting on AI-adjacent search performance.
- AIO trigger rate: the percentage of your tracked keywords where an AI Overview appears at all. This tells you how exposed your keyword set is to the shift.
- Citation rate / citation share: of the keywords that do trigger, the percentage where your domain is cited. Break this down by competitor to get share of voice.
- Citation position: where in the AI Overview's 3 to 8 sources your link sits. First cited and last cited are not equivalent.
- AI-source impression-to-click ratio: now partially available in GSC's AI segments.
- Traditional CTR on affected vs unaffected queries: this is your evidence of pressure.
Citation share as the new rank
If you have to pick one number to focus a team on, make it citation share, weighted by business value. Position one used to be the trophy because it captured the majority of clicks for a query. That is no longer reliable when an AI Overview sits above it. Being cited inside the overview, ideally among the first few sources, is the modern equivalent.
Being cited inside the AI Overview is the new position one. Being ranked below it, but uncited, is closer to the old position eleven than the old position two.
A useful reporting line looks something like this: "AI Overviews appear on 47 percent of tracked keywords, our citation rate is 23 percent, our main competitor's is 31 percent." That single sentence tells an operator more than a rankings table ever did.
How to weight your keyword set
Treating all keywords equally is the second most common mistake we see, after ignoring AI Overviews entirely. A keyword with 50,000 monthly searches that triggers an AI Overview matters far more than one with 200. Weight by search volume, then weight again by revenue proximity: a bottom-of-funnel commercial query is worth more than a top-of-funnel informational one, even at lower volume.
We score each tracked keyword on a simple 1 to 5 axis for both volume band and commercial intent, then multiply. Citation share is reported both as a raw percentage and as a weighted percentage. The two numbers often disagree, and the gap tells you where to invest content effort.
The third-party tool landscape
A new category of AI visibility tools has emerged in the last eighteen months. The named players worth evaluating:
- Semrush AI Visibility Toolkit: shows where your brand appears across AI platforms including Google's AI Overviews, which pages and topics are being cited, and the prompts driving that visibility.
- SE Ranking: tracks AI Mode results, competitor visibility, link presence dynamics and traffic forecasts.
- Otterly.ai, Profound AI, Peec AI: purpose-built AI visibility monitors, each with slightly different coverage across ChatGPT, Perplexity and Google's AI surfaces.
- Rankability Reporter: tracks whether you are the first cited source or further down, maps the competitive landscape, and produces a heatmap of which domains Google cites for your keywords over time.
- Scrunch AI: launched November 2024, aimed at enterprises needing structured control over how their brands appear across AI search. Serves 500+ brands including Lenovo and Penn State.
- seoClarity: has an AI Overviews filter within SERP Features that tracks AIO summaries as a "Top Insights" panel.
Detection alone is not the goal. The tools worth paying for are the ones that track citation identity (which URL of yours), competitive citation benchmarking, and position within the overview. If you are choosing between two tools, choose the one whose data you would actually put into a monthly report.
For the strategic layer that sits behind all this measurement, our guide on generative engine optimisation: how to get cited by AI Overviews and ChatGPT covers the content and technical patterns that increase citation likelihood in the first place.
Get plain-English guides like this in your inbox.
One short email a month. WordPress, Shopify, SEO, no fluff. Unsubscribe in one click.
We never share your email.
A lightweight tracking stack without enterprise spend
Not every team needs an enterprise platform. For founders and lean marketing teams, a workable stack looks like this:
- GSC AI segments: your baseline for impressions, clicks and CTR from AI surfaces on queries you already rank for.
- A SERP API (SerpAPI, DataForSEO or similar): pulls AI Overview presence and cited sources for a scheduled keyword list.
- A spreadsheet or lightweight database: stores daily or weekly snapshots so you can trend over time.
- A monthly manual audit: spot-check ten to twenty high-value queries in an incognito browser to catch what the APIs miss.
The pipeline is the same one the paid tools use internally: input a keyword list, collect SERP data via API, extract AI Overview information, save to a store, then calculate metrics. The trade-offs are honest ones. You get no historical data on day one, competitive benchmarking is limited to what you build yourself, and you will spend time on maintenance you would otherwise buy back.
# rough sketch of a daily job1. read keyword list (with volume + intent weights)2. for each keyword: query SERP API, capture AIO presence + cited URLs3. compute: trigger rate, our citation rate, competitor citation rate4. append snapshot to store with date5. weekly: diff vs last week; monthly: chart trendsThe technical substrate matters here. Sites with clean, well-marked-up content get cited disproportionately, which is why we treat structured data and schema for rich results and AI citation as a prerequisite for any serious AI visibility work. Topical authority with content clusters is the content-side lever that moves citation share upward over months.
For teams that would rather have this run for them, our SEO services include AI visibility tracking as part of the standard reporting we send clients.
The mistakes that skew your data
A few patterns come up repeatedly when we take over tracking from an in-house team or a previous agency.
Reading weekly numbers as strategic signals. Google actively A/B tests AI Overview formats, lengths and source selection. A one-week drop in citation rate is often a testing cycle, not a permanent change. Use monthly trends for decisions; use weekly numbers only to spot outliers worth investigating.
Reporting aggregate CTR without segmenting by AIO presence. Your overall CTR can look stable while your AIO-affected queries are collapsing and your unaffected queries are rising. The average hides both movements. Always segment.
Treating impressions as a health metric. Impressions are now closer to a reach metric than a demand metric. Clicks, cited traffic and downstream conversions are the real health indicators.
Ignoring brand-mention citations. If an AI Overview mentions your brand name in the generated text without a link, that is still a form of visibility, and it is invisible to GSC. Some third-party tools now surface this; if yours does, track it.
Setting the tracking up once and never revisiting. Google is changing the AI surfaces monthly. Any tracking configuration you set today should be reviewed against Google's search documentation and your tool vendor's changelog at least quarterly.
A pragmatic reporting cadence
Weekly: divergence check in GSC, flag anomalies. Monthly: full citation share report by keyword segment, weighted by business value. Quarterly: review the metric set itself and whether Google's changes have made anything obsolete.
The teams handling this well have accepted a simple truth: measurement is now harder, more expensive and more contested than it used to be, and there is no clean single number that captures search performance. The teams who invest in the new metric set are seeing real advantages, both in traffic and in the strategic clarity of knowing what actually moves the needle.
If you want to see how we run this for real clients, the work page shows what the reports look like in practice. The reports have changed. The discipline behind them, if anything, matters more than before.